Sales Leaderboard Report
Summary
The Sales Leaderboard Report (formerly Sales Leaderboard, and Sales Reps Stats Report) report offers different statistics for sales-related users. This allows Sales leaders to monitor relative job performance and compare them to other Reps and Teams.
It reveals areas of both concern and needed improvement and exceptional performance.
Important Points:
- Check out the Sales report under Customers > Sales Report to see the customers behind these stats.
- See the FieldRoutes Mobile: Leaderboard guide for more information about this feature in the mobile app.
- See the Composite Score guide for more information on Composite Scores.
- If the user uses the same filters, they can be saved by clicking Show Saved Filters, and saving filters under a name.
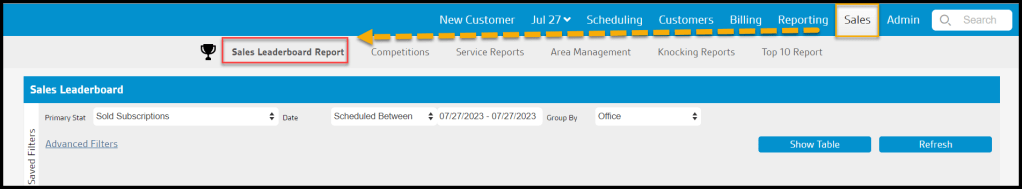
Accessing the Sales Leaderboard
To access the Sales Leaderboard Report, navigate to:
Sales > Sales Leaderboard Report.
Basic Filters
There are three Basic Filters for customizing the view of this report:
- Primary Stat: This is the statistic that will be displayed for each office on the Office Leadboard and for each user on the Technician Roster. In addition, the offices and technicians will be ordered by the specified statistic in descending order.
- Sold Subscriptions: Display the number of subscriptions sold by that user or Office.
- Serviced Subscriptions: (New) Display the number of subscriptions serviced by that user or Office.
- Serviced/Sold: Display the number of Serviced over Sold Services by that user or Office as a fraction.
- AutoPay %: Displays the percentage of customers with AutoPay.
- Subscriptions Active: Display the number of active subscriptions by that user or Office.
- Serviced AutoPay %: Displays the percentage of customers serviced with AutoPay.
- Average Contract: (Formerly Average Sold Contract) Displays the average sold contract value for that user or Office.
- Average Initial Price: Displays the average serviced/pending contract initial price for that user or Office.
- Total Revenue: (Formerly split between Total Sold Contract and Total Serviced Contract) Displays the total Sold and Serviced contract revenue associated with that user or office.
- Switch-Overs: Displays how many customers were switched over from another company associated with that user or office.
- Multi-Years: Displays the number of multi-year contracts associated with the user or office.
- Paid In Fulls: Displays the number of accounts flagged as Paid In Full associated with that user or office.
- Bad Payment Methods: Displays the number of bad payment methods associated with that user or Office.
- Knocks %: Displays the number of knocks associated with that user or Office.
- Composite Stat: A composite stat is a combination of two or more selected primary stats with their respective targets and weights. The composite stat calculates a percentage of the data for each selected primary stat according to their weight and target values. See the Composite Stat Preference guide for more information.
- Date: In this field, you can enter your desired date range for the report. Select “Sold On” to view only customers sold services between the selected date range, or select Scheduled For to view customers scheduled between your selected date range.
- Group By: Group options available are:
- Office: Group the results by Office.
- Teams: Group the results by Teams.
To filter the report with more options, select the Advanced Filters button. See below for detailed information.
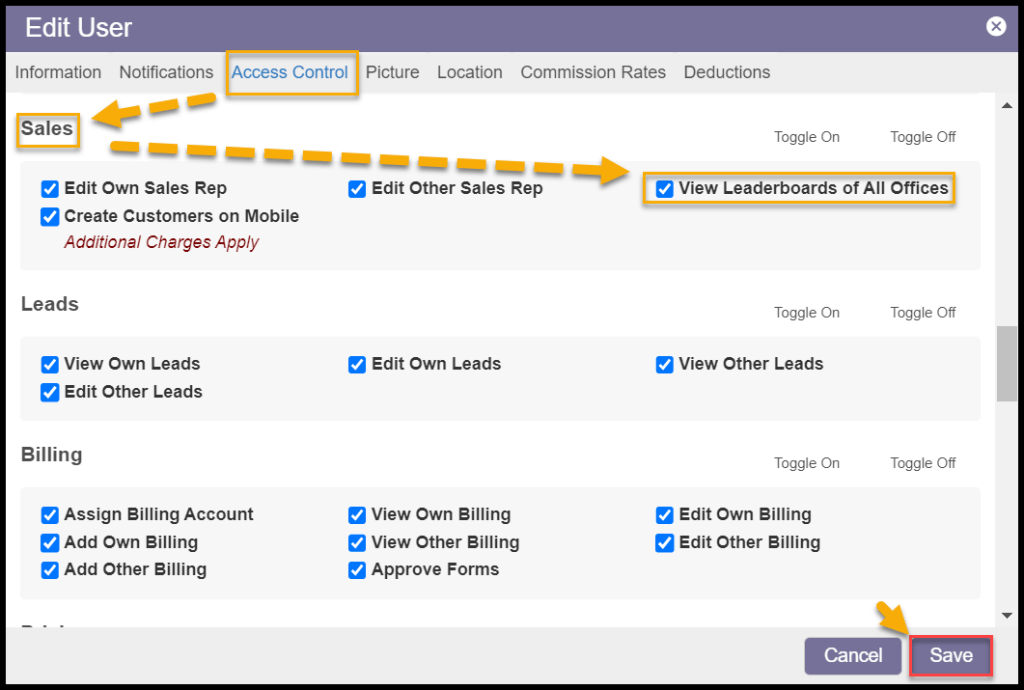
Limit Leaderboard View to Local Office Teams
By default, all Offices associated with a company are visible, but deselecting the Access Control:
User > Access Controls > Sales > View Leaderboards of All Offices
That user’s Leaderboard view will be limited to only those Teams within their own Office.
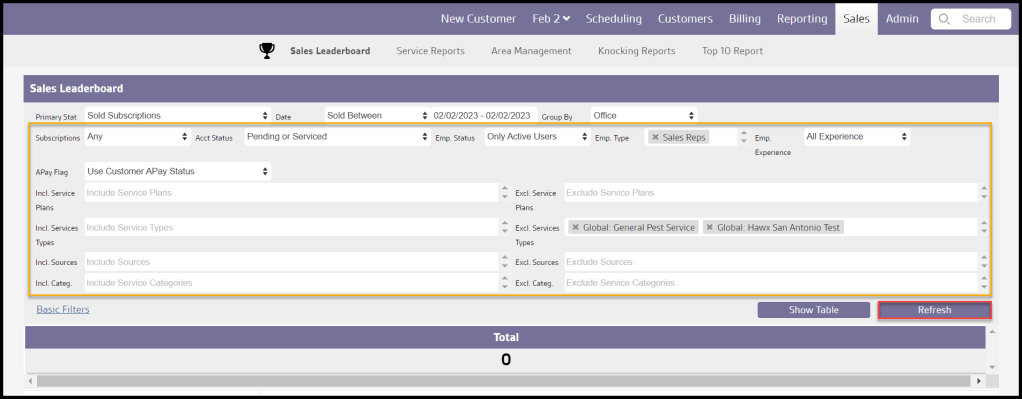
Advanced Filters
Selecting the Advanced Filters button will open up several additional elements with which to customize the results:
- Subscriptions
- Any: Display all results regardless of status.
- Active: Limit results to those with Active subscriptions.
- Frozen: Limit results to those with frozen subscriptions.
- Acct Status:
- Only Pending/Serviced [Good Accounts]
- All Sold Appointments [Includes Cancels]
- Only Stops ‘On Route’ [Completion Numbers]
- Only Serviced
- Employee Status:
- Only Active Users
- Only Inactive Users
- Active/Inactive Users
- Employees: Narrow by employee Role or Experience
- Role:
- All Employees
- Office Staff: Limit results to Office Staff.
- Technicians: Limit results to technicians.
- Sales Reps: Limit results to Sales Reps.
- Experience:
- All Experience: Display results from sales reps with all experience levels.
- First Years: Display only results from sales reps with first year experience.
- Experienced: Display only results from sales reps with greater than first year experience.
- Role:
- APay Flag:
- Use Customer APay Status
- Use Salesman APay Flag
- Incl. Services Plans: Includes all Service Plans by default, or choose specific Service Plans to view.
- Excl. Services Plans: Excludes no Service Plans by default, or choose specific Service Plans to leave out
- Incl. Services Types: Includes all Service Types by default, or choose specific Service Types to view
- Excl. Services Types: Excludes no Service Types by default, or choose specific Service Types to leave out
- Incl. Sources: Includes all Sales Sources by default, or choose specific Sales Sources to view
- Excl. Sources: Excludes no Sales Sources by default or choose specific Sales Sources to leave out
- Incl. Categ.: Includes all Service Types Categories by default, or choose specific Categories to view.
- Excl. Categ.: Excludes no Service Type Categories by default, or choose specific Categories to leave out
To apply desired filters, select the Refresh button..
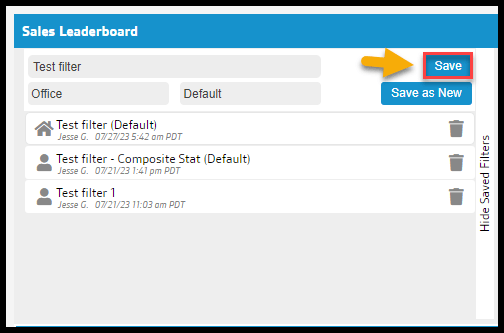
Saving Leaderboards Filters
To show Saved Leaderboard Reports, Show Saved Filters.
- Name: Name the Leaderboard Report.
- Office: Determine where the custom Leaderboard Report will be available to the user, the offices, or global.
- Default: Determine whether the Leaderboard Report will be default or not.
Choose Save to save changes to an existing Saved Leaderboard, or Save as New to create a new Leaderboard.
NOTE:
The date filter will not be saved as a preset.
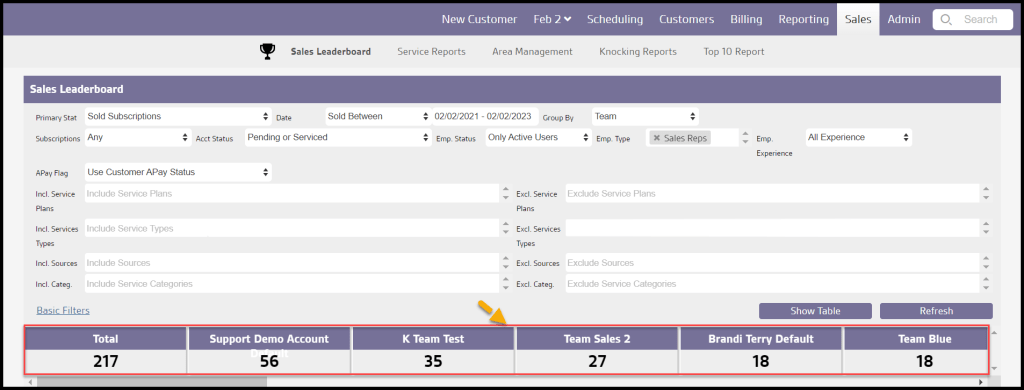
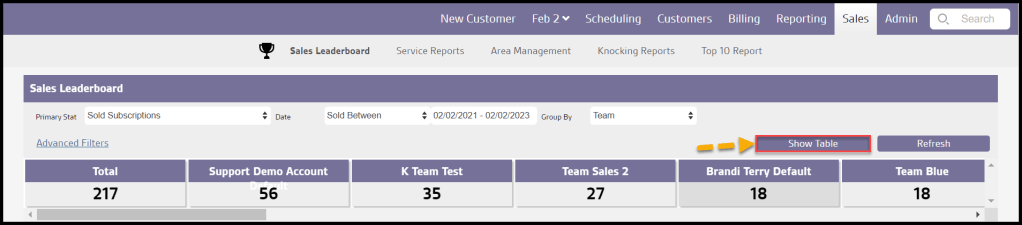
Office/Team Leaderboard
Highlighted is the Leaderboard. This is designed to display each Office or Team (depending on the Group by filter) based on the selected Primary Stat Value, such as Sold Customers.
To see more information about a specific Office/Team, select it on the Leaderboard.
Sales Rep Roster
Once the desired Office/Team is selected in the Leaderboard, you will see a Sales Rep Roster to the left of the report. This Roster displays a box for the Office/Team selected and each Sales Rep with their respective Primary Stat Value.
Sales Reps are displayed in descending order based on the selected Primary Stat Value and clicking on the Office/Team, or one of the Sales Reps will display the corresponding Baseball Card.
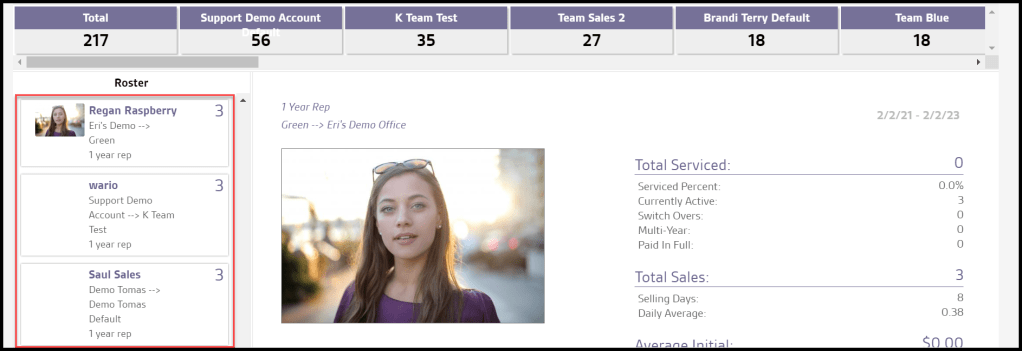
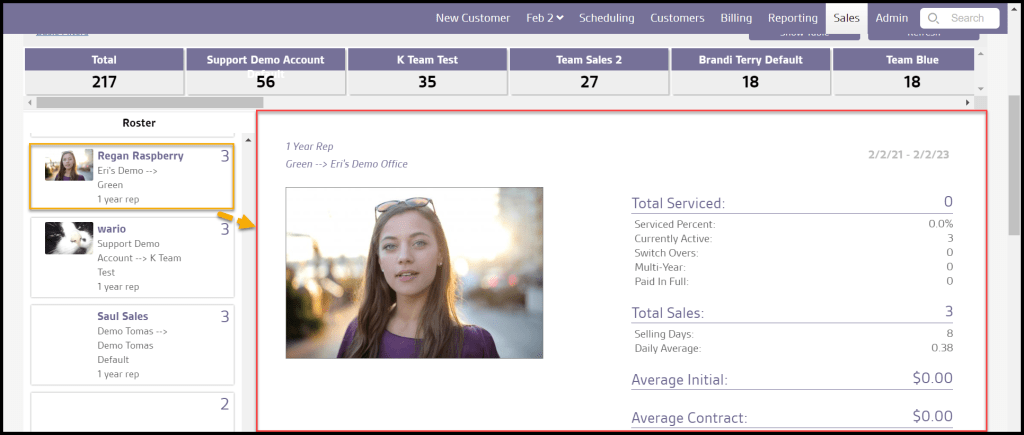
Baseball Card View
Select a Sales Rep in the Roster to view the Baseball Card. The Baseball Card displays the selected primary stat and its value.
The Baseball Card also includes useful information such as the Total Serviced, Total Sales, Daily Average, Serviced Contract, Serviced Initial, and Serviced Autopay Percentage.
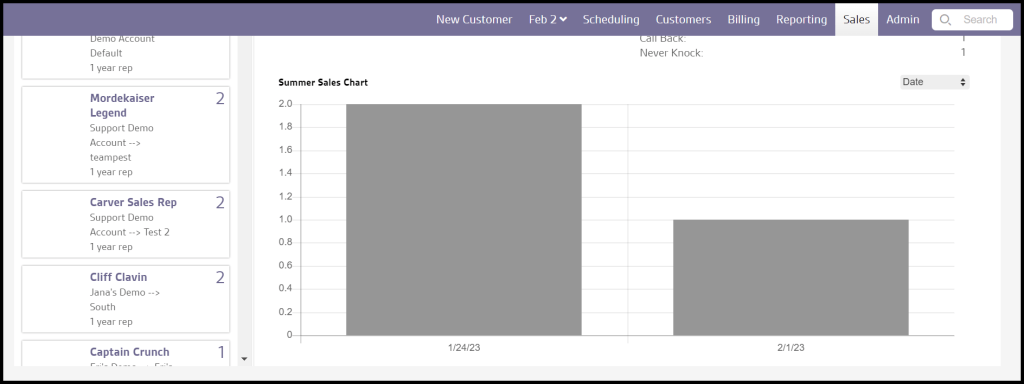
The Summer Sales Chart shows data using the parameters at the top.
Show Table/Show Cards Toggle
Instead of the Baseball Card view, a Sales Roster/Reps table view may be viewed using the Show Table toggle. Once in the Table view, the button will offer the option to Show Cards to switch back
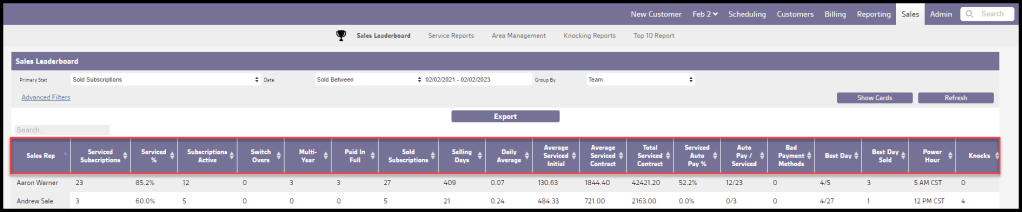
Viewing the Sales Leaderboard Data Columns
The Sales Leaderboard Report has several data columns to help track Sales Rep’s performance.
- Sales Rep: Displays the name of the Sales Rep.
- Serviced Subscriptions: Displays the number of serviced subscriptions associated with the Sales Rep.
- Serviced %: Displays the percent of subscriptions that were serviced.
- Subscriptions Active: Displays the number of active subscriptions associated with the Sales Rep.
- Switch Overs: Displays the number of customers switched over from other companies associated with the Sales Rep.
- Multi-Year: Displays the number of multi-year contracts associated with the Sales Rep.
- Paid In Full: Displays the number of accounts paid in full.
- Sold Subscriptions: Displays the number of subscriptions sold by the Sales Rep.
- Selling Days: Displays the number of days the Sales Rep was selling Services.
- Daily Average: Displays the average number of sales the Sales Rep sells daily.
- Average Serviced Initial: Displays the average contract initial price for the Sales Rep.
- Average Serviced Contract: Displays the average contract value for the Sales Rep.
- Serviced Auto Pay %: Displays the percentage of autopay customers serviced.
- Auto Pay / Serviced: Displays the fraction of autopay customers over serviced customers.
- Bad Payment Methods: Displays how many times a payment method was bad.
- Best Day: Displays the day when the Sales Rep made the most sales.
- Best Day Sold: Displays the number of services sold on the day with the highest amount sold.
- Power Hour: Displays the time when the Sales Rep makes the most sales.
- Knocks: Displays the number of knocks made by that Sales Rep.
Toggle the order Sales Leaderboard’s data columns by selecting the up and down arrows.
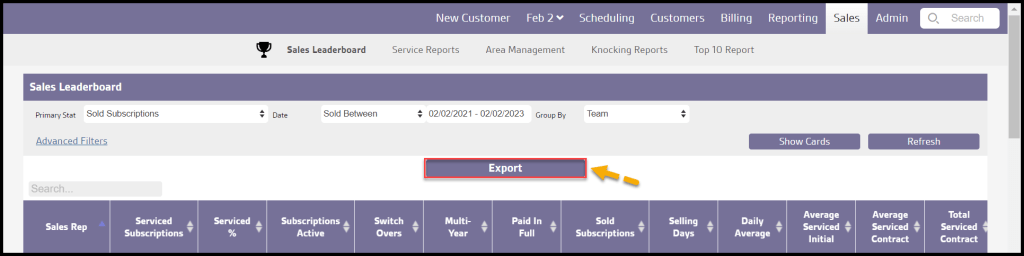
Exporting the Sales Leaderboard Report
To export the Sales Leaderboard Report as a CSV File, Select Show Table, then Export.