PestRoutes Tech: Diagramming Tool
Summary
The diagramming tool is used for creating diagrams for service quotes and history.
The diagram, along with a diagram legend, can also be added to Custom Forms and certain WDI Forms. Please contact support for more information on this.
Important Points:
- To add more diagram markers, please see the guide on diagram markers.
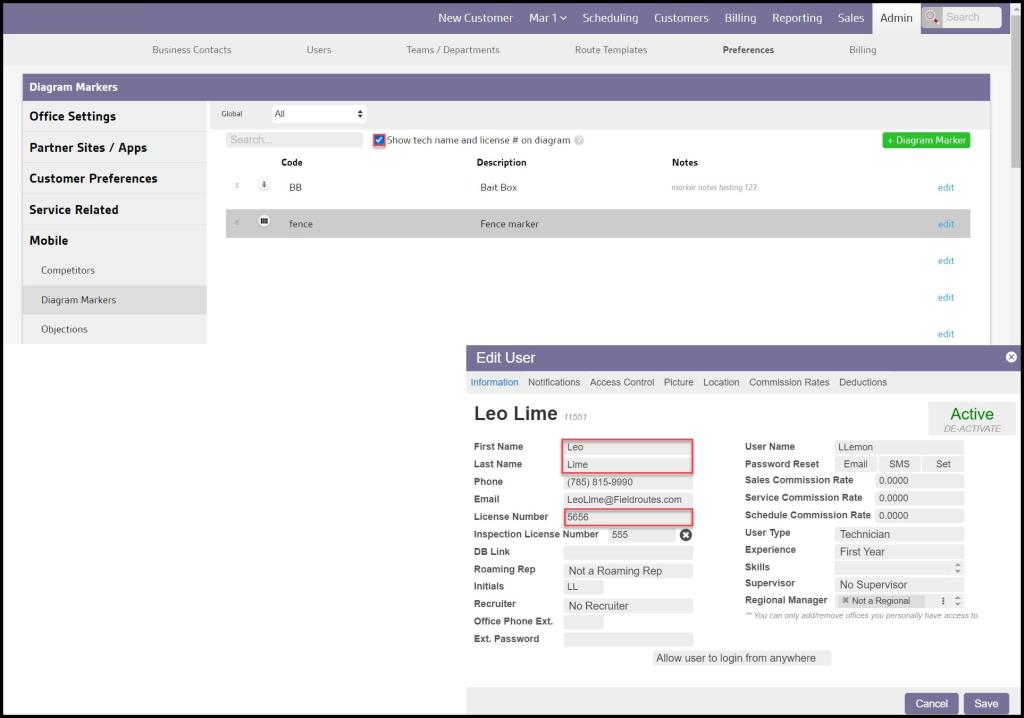
- The tech name will display automatically based on the logged-in user that is viewing the diagram, if Show tech name and license # on diagram (Admin > Preferences > Mobile > Diagram marker) has been selected. If the user has a license number (Admin > Users > Select the Preferred User > Information > License Number), that will show as well.
Accessing the Diagramming Tool in PestRoutes Tech
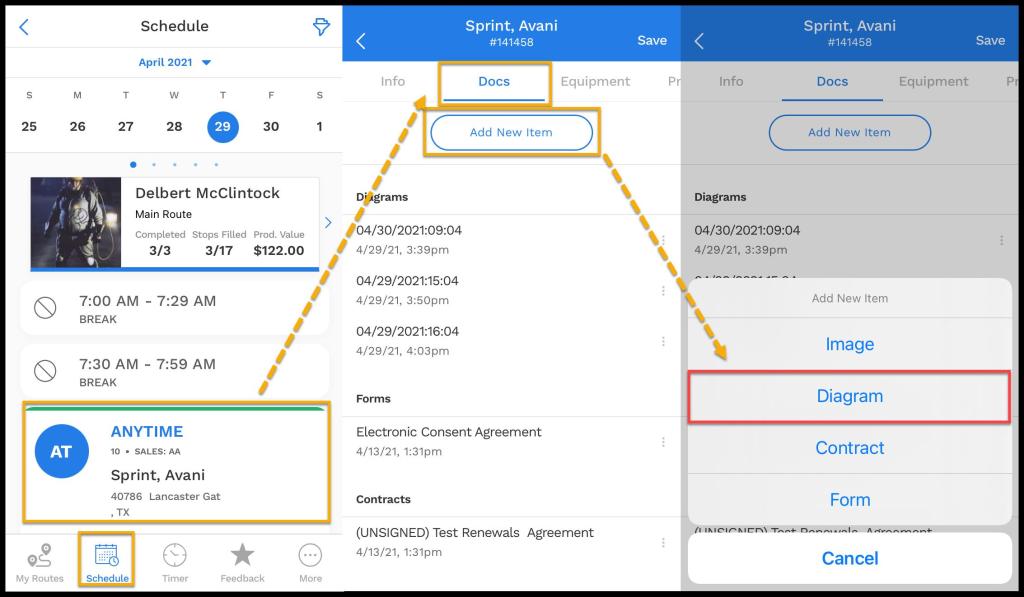
To access Diagramming Tool Feature, log into PestRoutes Tech and go to:
The Customers Appointment > Docs.
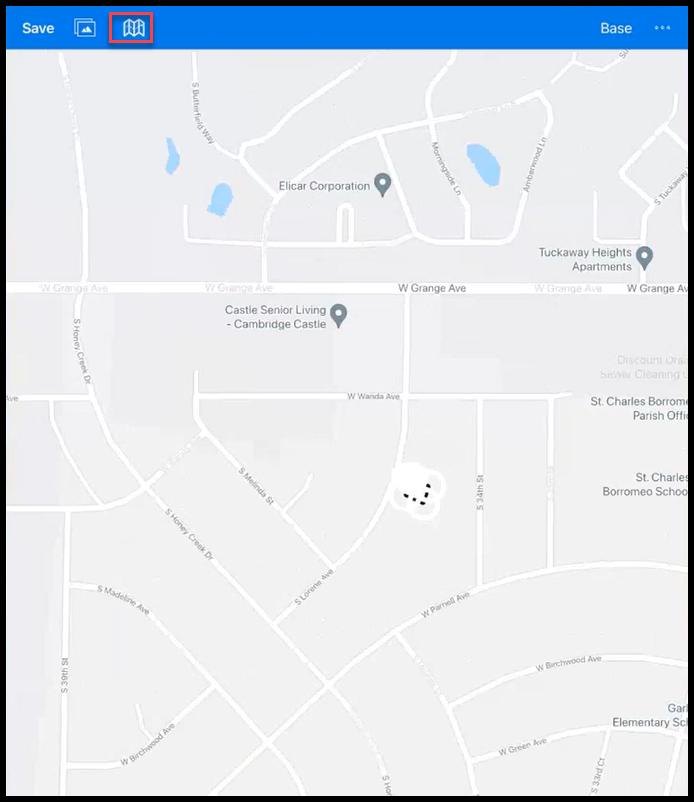
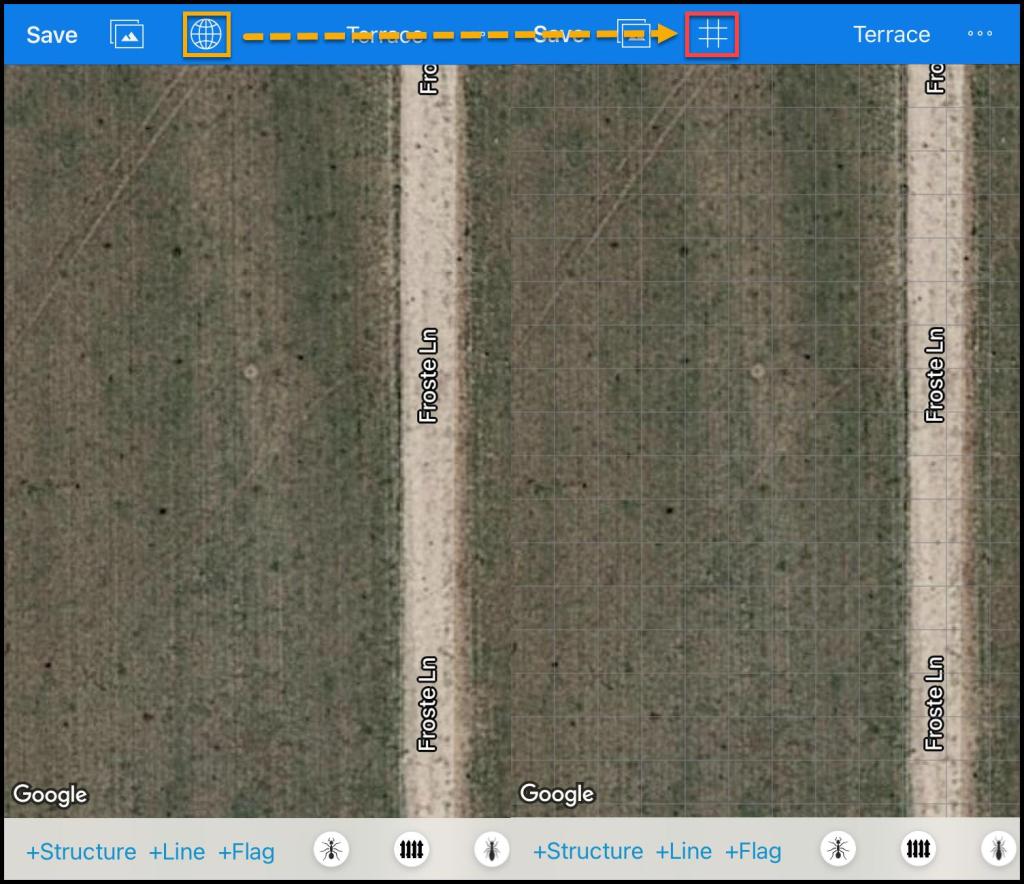
Pressing the globe icon third from the left at the top will apply a grid on the Google Map view. This is helpful when drawing diagrams to ensure everything is accurate.
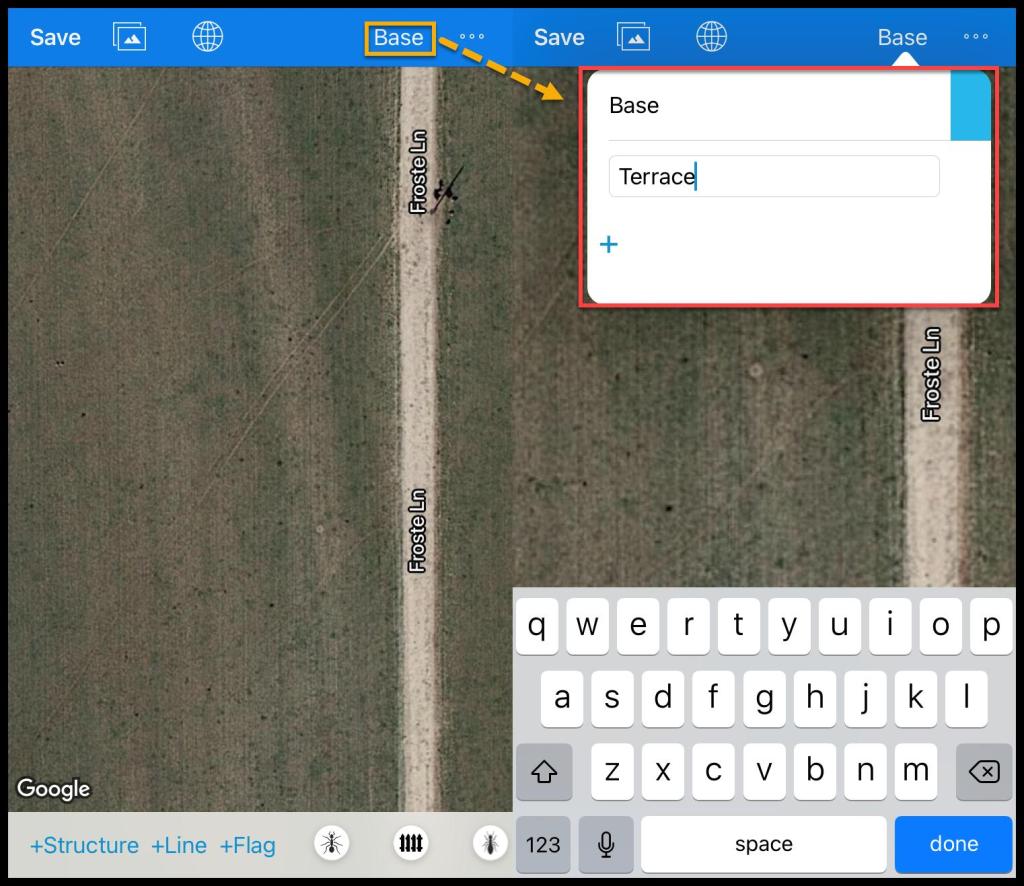
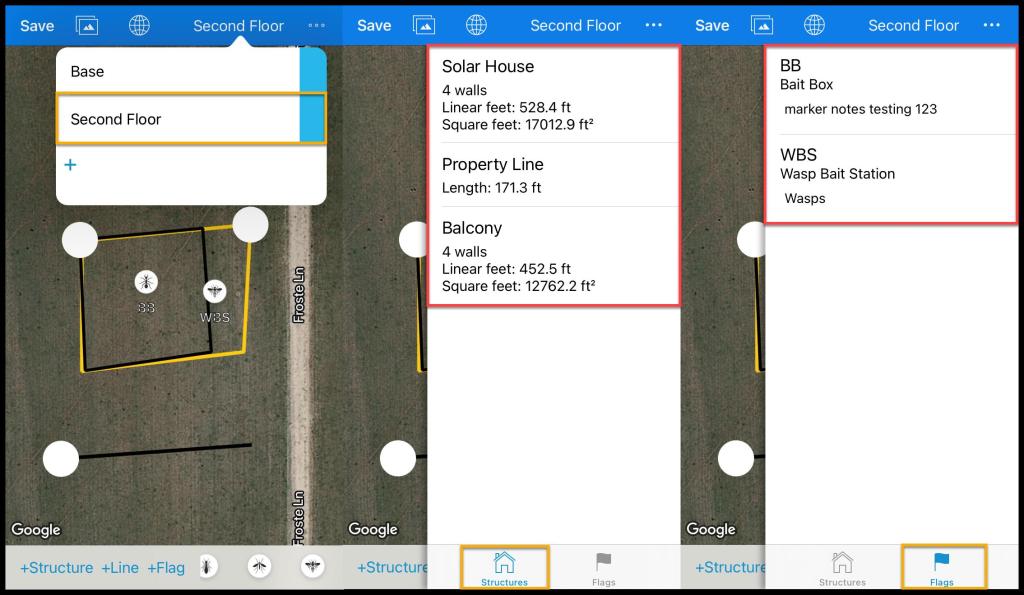
Pressing Base will add, delete, or edit other layers in the upper right-hand corner.
Viewing the list of structures, lines and flags
To view the list of structures, lines, and flags, press the icon with … next to the layer button to open a list of structures, lines, and flags on the selected layers.
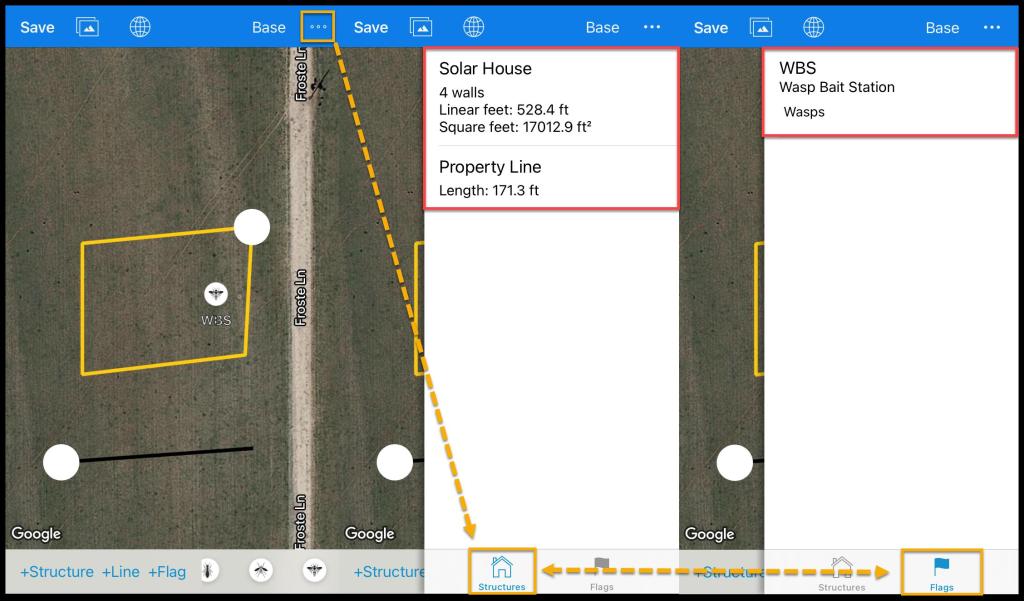
The list will show all of the structures, lines, and flags on the selected layers.
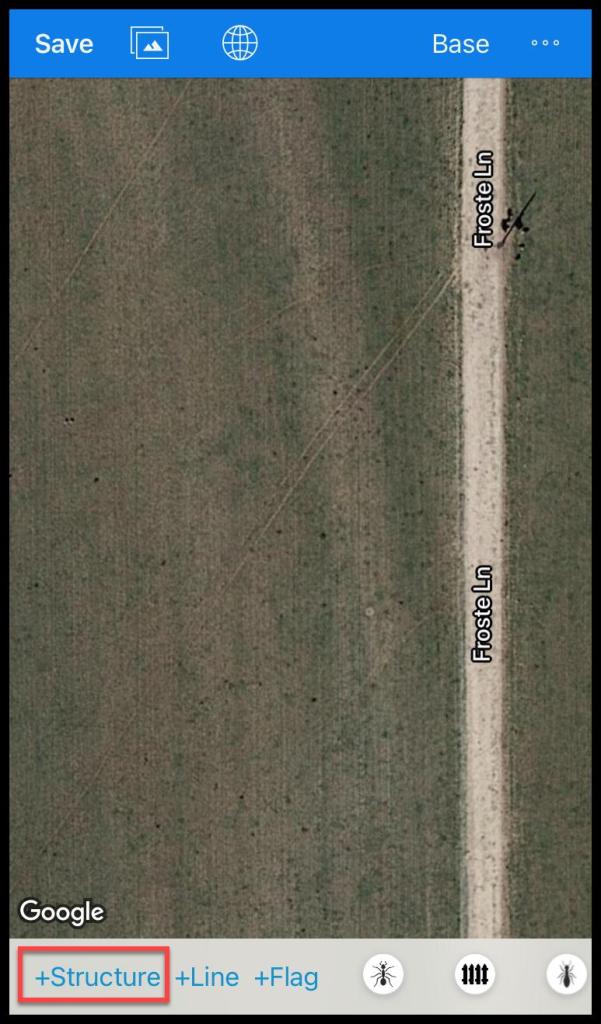
Adding a new Structure
To add a new structure, press + Structure. This will allow a border to be drawn around the customer’s property.
To draw the border, press each corner around the property to create a border around the property. Each point can be tapped and then removed in order to move it.
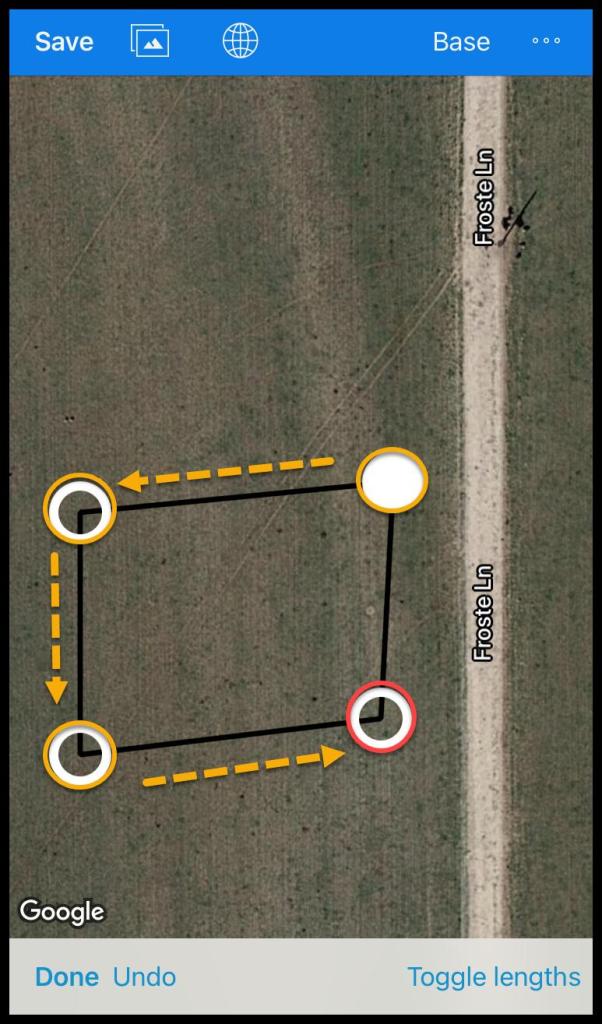
Press Undo to undo the most recent move.
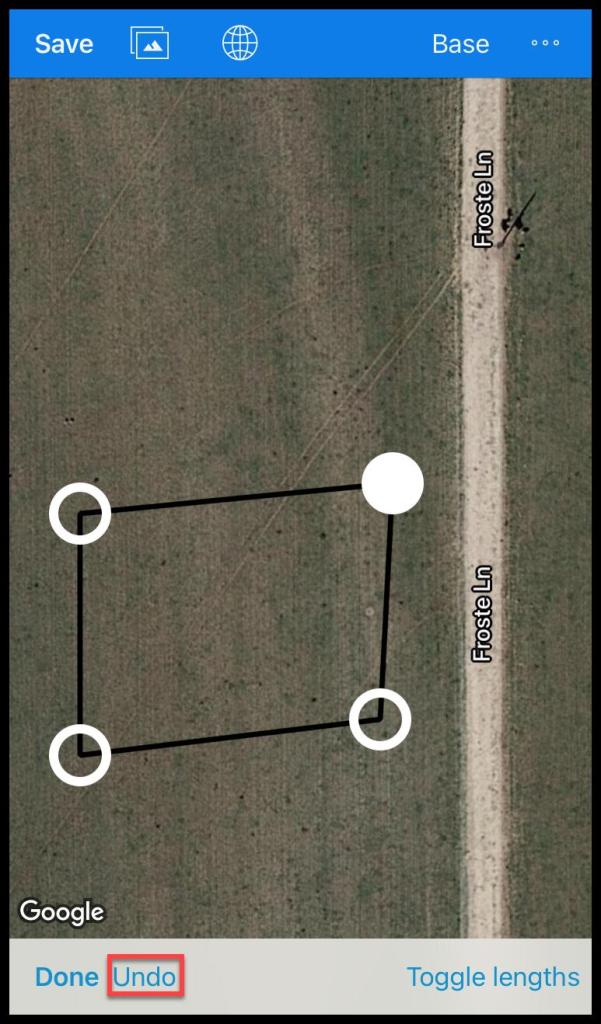
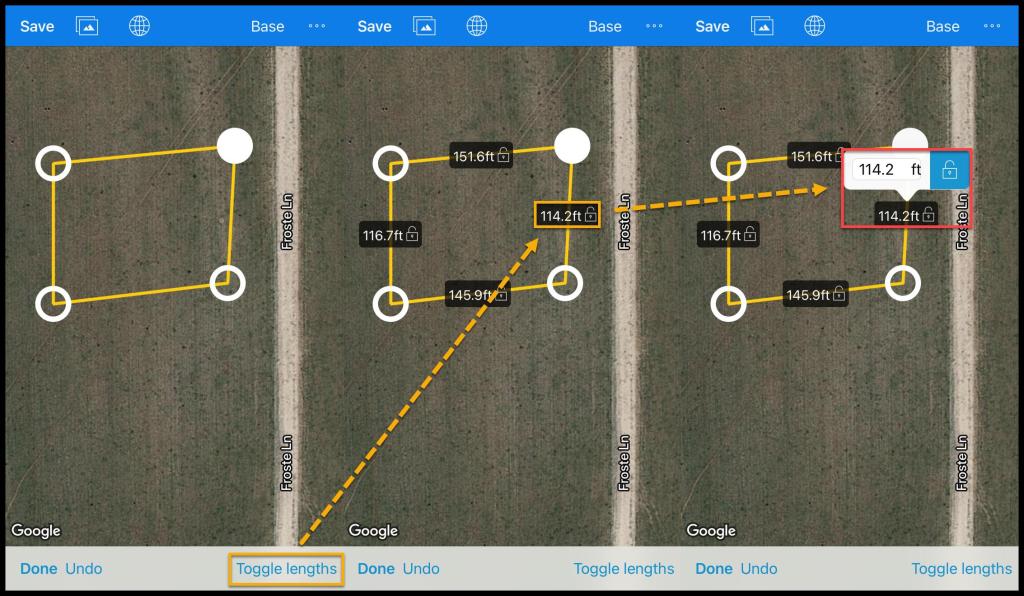
There is also an option to Toggle Lengths. This feature will use Google Maps to determine the actual length of each side of the property. Press this option to toggle the view of the lengths on or off.
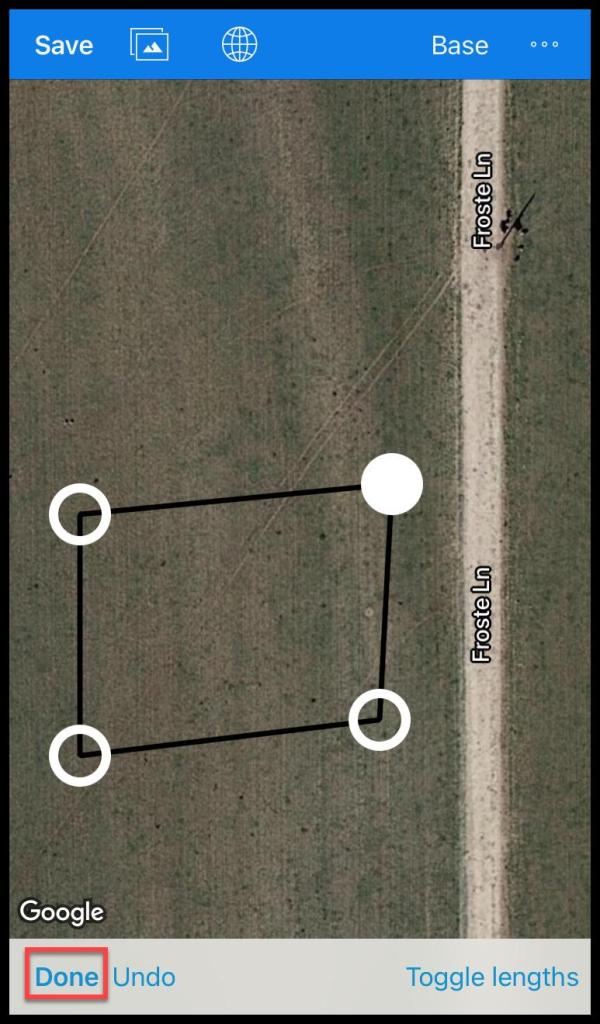
When finished with changing the map, press Done.
Editing a Structure
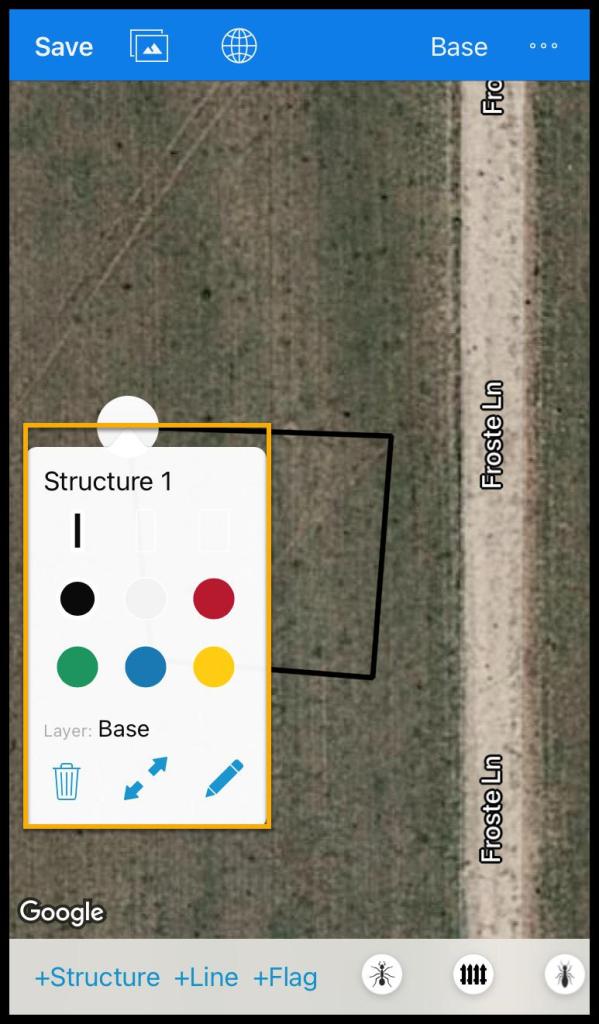
Once Done is pressed, the recently-created structure will be labeled Structure 1.
Press Structure 1 to edit the name of the structure. The thickness and color of the structure’s lines can be changed. The structure’s layers can be toggled by pressing Layer: Base. Press the trash can to remove the structure, use the arrows to toggle the length on or off, or edit the structure with the pencil icon.
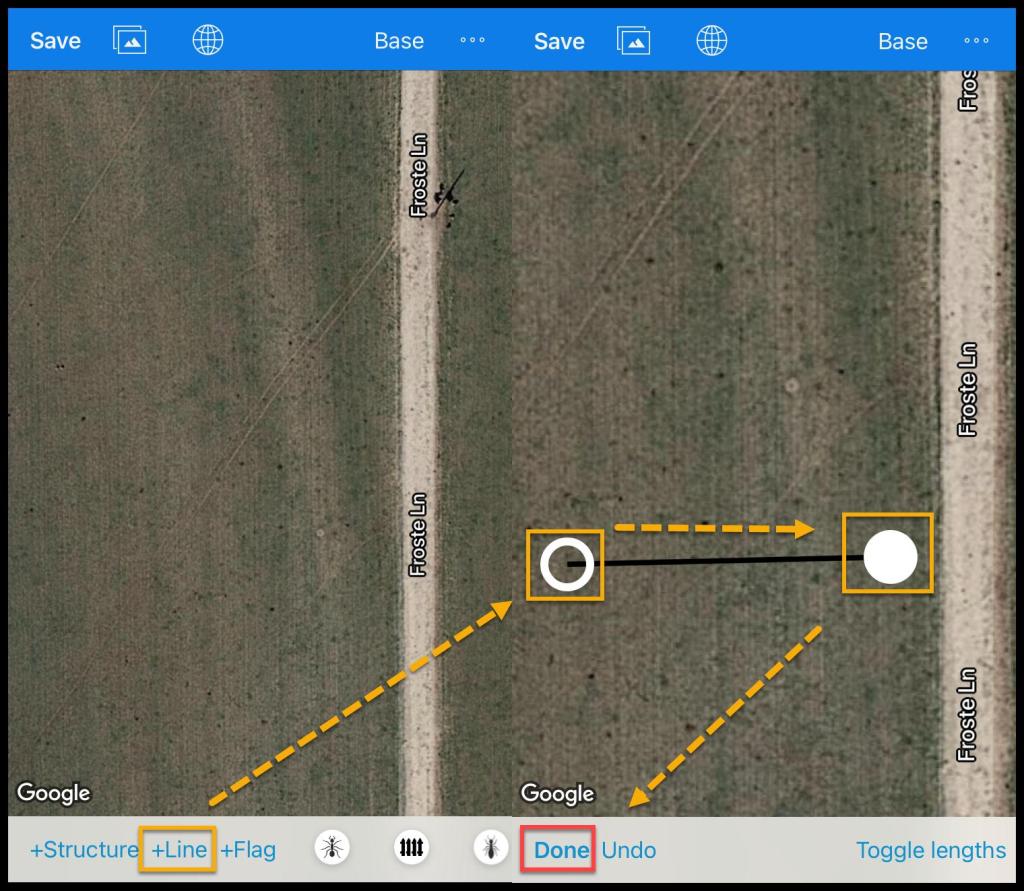
Adding a new Line
Creating lines has the same capabilities as creating structures. To create a line, press + Line.
Lines and structures are different because lines do not automatically connect the same way structures do.
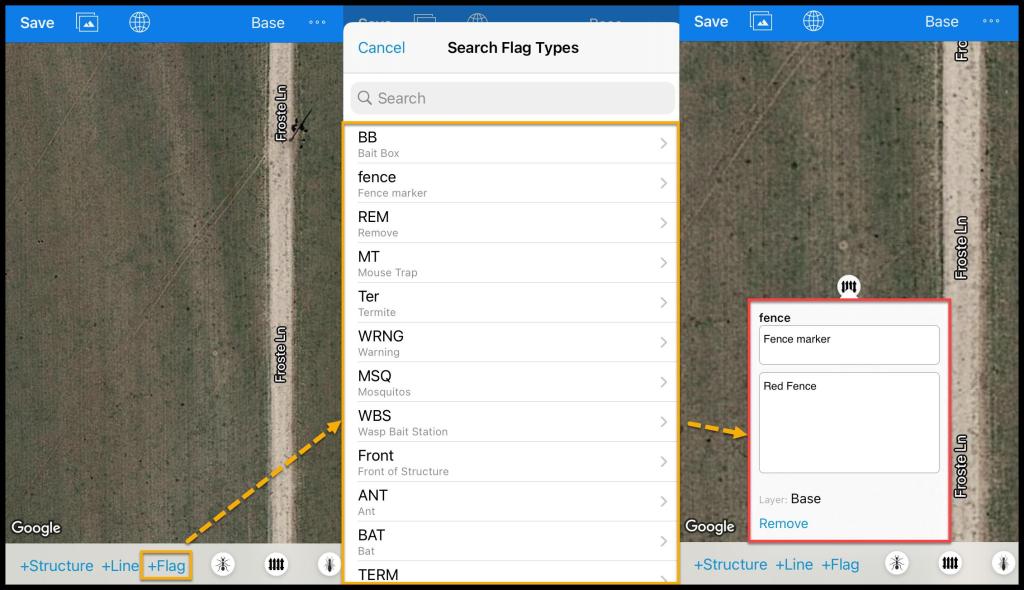
Adding a new Flag
Add flags to the diagrams by pressing “+ Flag”.
Once “+ Flag” is pressed, there is a list of all the flags that have been created in PestRoutes.
Press the desired flag. The flag will have options to rename it, attach notes, change the layer, and remove it. Drag and drop the flag on the map to place the flag in another location. To add and edit Flags, see the guide on Diagram Markers.
Adding a Tech Name and License
The tech name will display automatically based on the logged-in user that is viewing the diagram, if Show tech name and license # on diagram (Admin > Preferences > Mobile > Diagram marker) has been selected. If the user has a license number (Admin > Users > Select the Preferred User > Information > License Number), that will show as well.
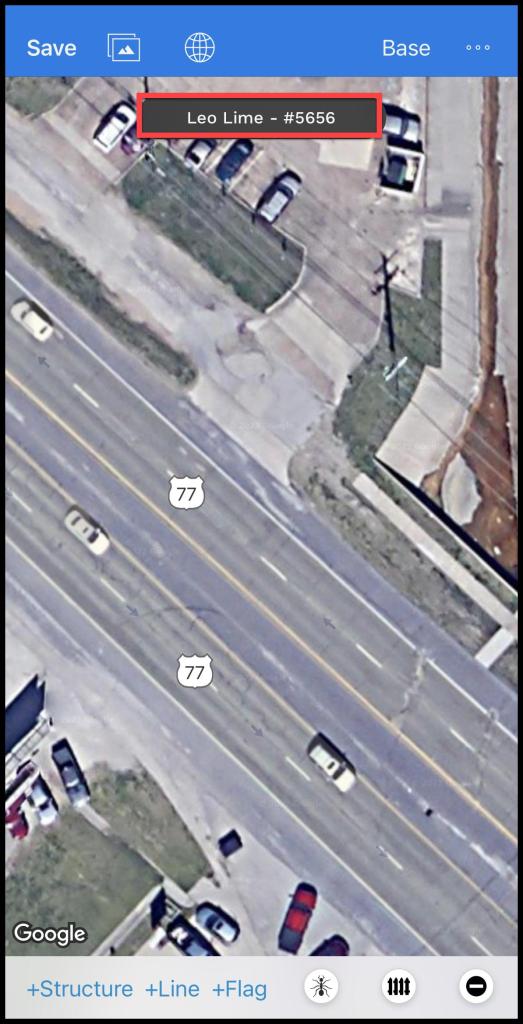
NOTE:
The user must have a license number on their User Card to show a license number.
Saving the Diagram
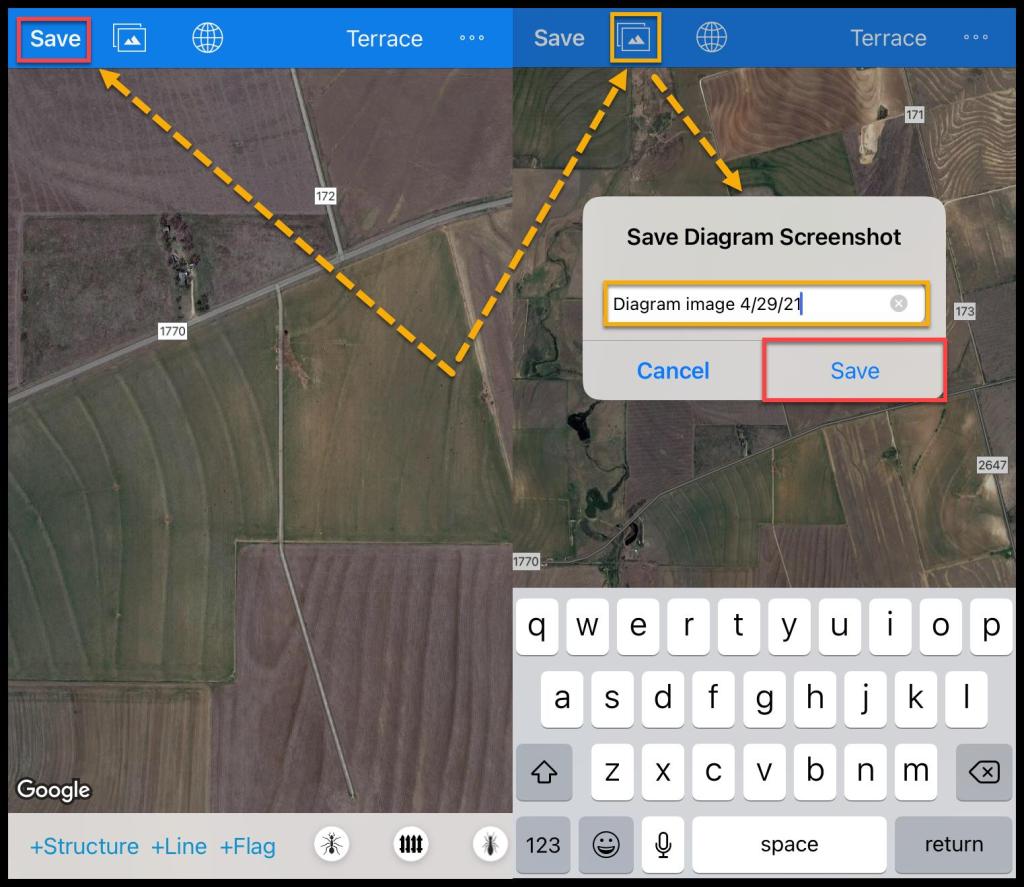
Once the diagram is completed, there are a few different ways to save it.
- Save Option: This button will only save the diagram under the Docs tab. Once “Save” is pressed, the option to rename the diagram will become available.
- Screenshot: To save the diagram to Pestroutes and to add the diagram to forms, save the diagram as a screenshot. Tap the icon to the right of the “Save” button. This action will also allow the user to rename the diagram as well.
Map View
Map View allows a technician to diagram a property that is located under a tree canopy or obstructing foliage. Drawing without Map View can cause the structure outline to be inaccurate, which can cause the report to be rejected.