
Inventory Reports
Summary
The Inventory Reports are a compilation of six different reports:
- Manage Inventory: Manage, add, and delete product inventory within the office.
- Distribute Inventory: Specify the amount of product distributed to each employee.
- Chemical Tracking Report: Establish the value of the changes made in the inventory.
- Inventory Changes Report: See a history of changes in product inventory.
- Employee Usage Report: See the amount of product used by each employee and the amount of product used for each appointment.
- State Chemical Report: See the amount of product used in each county that is serviced.
These reports are vital for managing, adding, and auditing product inventory.
Important Points:
- Before using the Chemical Inventory report, the chemical units and default dilution rates must be set correctly in Admin > Preferences > Products. Please see our guide on Products for more information.
- To add Vendors to these reports, go to Admin > Preferences > Vendors. See our guide on Vendors for more information.
- All dollar values are rounded to the nearest whole cent.
Accessing the Inventory Reports
To access the Inventory Reports, navigate to the Reporting tab and select Inventory at the top of the page.
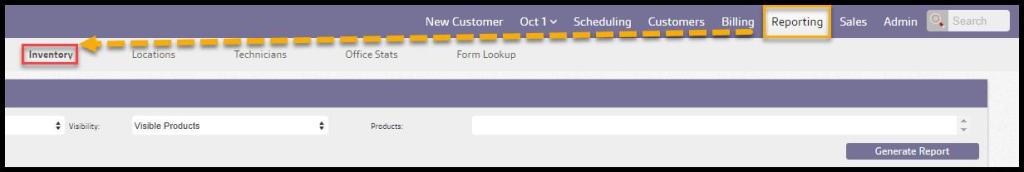
Accessing the Inventory Reports
There are six different reports on the left side of the page to assist the user with inventory tracking.
Each report will be detailed in its section below.
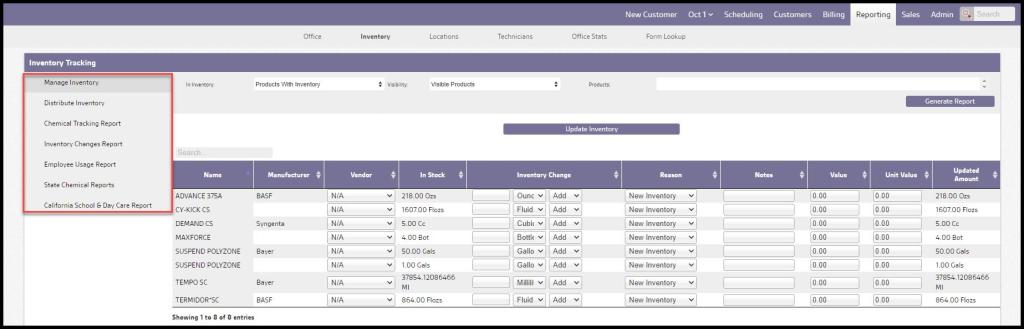
Accessing the Manage Inventory
The Manage Inventory report is designed to manage, add, and delete product inventory within the office. The guide will detail the filters for the report below. To access the Manage Inventory report, go to:
Reporting > Inventory > Manage Inventory.
Using the Manage Inventory Filters
The Manage Inventory Report has several filters that can be applied.
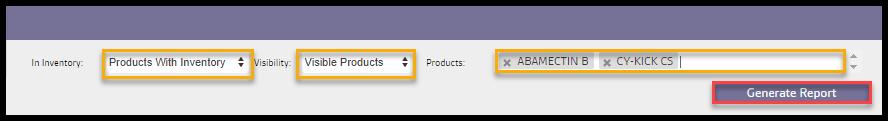
- In Inventory: This filter determines which products will be displayed in the report.
- Products With Inventory: Displays only products that are currently in stock. This filter is selected by default, so make sure to change this to “Products Without Inventory” or “All Products.”
- Products Without Inventory: Shows all products that do not have a current inventory (not in stock).
- All Products: Displays all products regardless of their inventory.
- Visibility: This filter is based on a product’s visibility under Admin > Preferences > Products.
- Visible Products: Will display only products that are visible.
- Hidden Products: Shows products that are hidden in the product preference.
- All Products: Displays both visible and hidden products.
- Product(s): Filter specifically which products will be included in the report.
Once the desired filters are applied, select Generate Report to view the results.
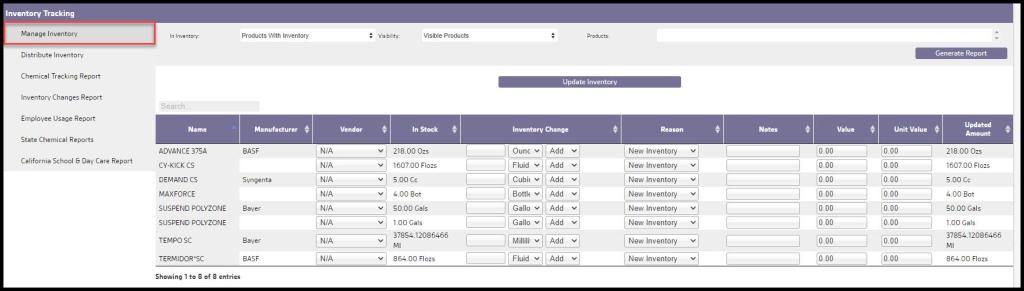
Using the Manage Inventory Data Columns
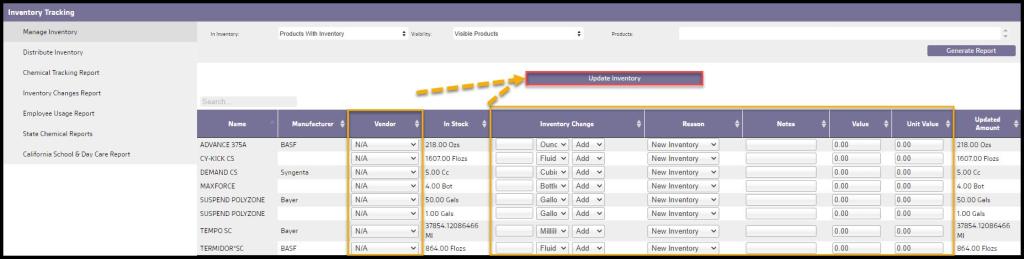
The first four columns in the Manage Inventory report display the name of the product, the manufacturer, the vendor, and the amount of product in stock (this value does not include the amount of product on technician’s vehicles, only what is in the office).
- Inventory Change: This column allows any changes in the inventory to be made. In the blank field, enter the amount of the product and select the unit of measurement for the amount that is being updated. Then select whether the user is adding more product, removing product, or updating the amount of product. If the user selects Add, it will add this amount to the total under the “In Stock” column. Select Remove to subtract from the amount in stock. If there is an error with the amount in stock and the user needs to update it completely, select Update.
- Reason: The reason for the changes being made. It can be because of new inventory, inventory returned from a technician, used inventory, or an error in inventory.
- Notes: This field is to allow the user to enter in any necessary notes with the inventory changes. There is a limit of 25 characters.
- Value: This field is to specify the cost of the inventory that the user is updating. This field only pertains to the amount being updated, not the amount that is currently in stock. For instance, if the user is adding 10 bait boxes to the user’s inventory, this value would be for the total cost of the 10 bait boxes the user is adding.
- Unit Value: This will be the unit value of the product. For example, if the user is adding 10 bait boxes to the inventory, this value would be for the total cost of 1 bait box. This value will auto-populate as long as the user has entered something under the “Value” column.
- Updated Amount: This column shows how much product will be in stock after the inventory is updated.
Select Update Inventory to save changes.
Accessing the Distribute Inventory
The Distribute Inventory report allows the user to specify the amount of product distributed to each employee. The filters at the top function are the same as the Manage Inventory report. To access the Distribute Inventory report, go to:
Reporting > Inventory > Distribute Inventory.
Using the Distribute Inventory’s Filters
The Distribute Inventory Report has some filters that the user can apply.
- In Inventory: This filter determines which products will be displayed in the report.
- Products With Inventory: Displays only products that are currently in stock. This filter is selected by default, so make sure to change this to “Products Without Inventory” or “All Products”.
- Products Without Inventory: Shows all products that do not have a current inventory (not in stock).
- All Products: Displays all products regardless of their inventory.
- Visibility: This filter is based on a product’s visibility under Admin > Preferences > Products.
- Visible Products: Will display only products that are visible.
- Hidden Products: Shows products that are hidden in the product preference.
- All Products: Displays both visible and hidden products.
- Product(s): Filter specifically which products will be included in the report.
Once the desired filters are applied, select Generate Report to view the results.

Using the Distribute Inventory’s Data Columns
The Distribute Inventory report allows the user to specify the amount of product distributed to each employee. The filters at the top function are the same as the Manage Inventory report.
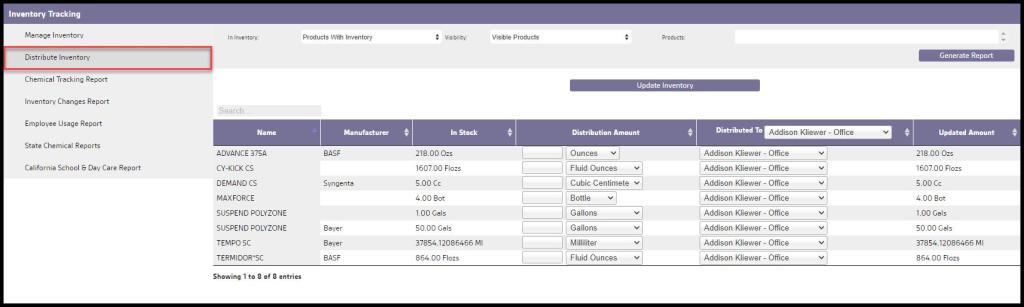
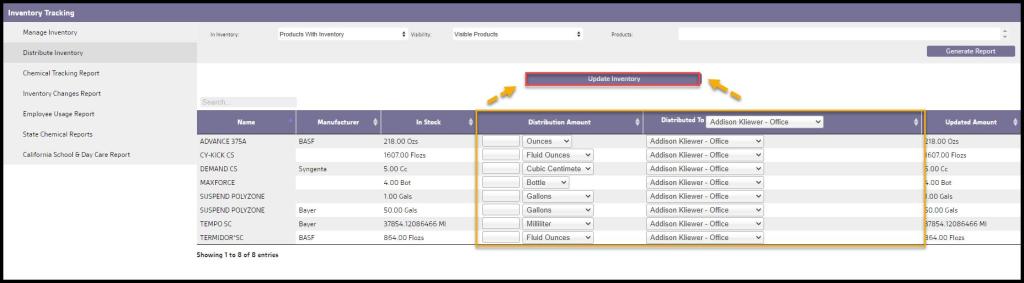
The first three columns in the Distribute Inventory report display the name of the product, the manufacturer, and the amount of product in stock.
- Distribution Amount: This column is to specify the amount of product to distribute to a user. The system will not allow the user to distribute more products than what is currently in stock.
- Distributed To: To specify which user the product is being distributed to. The column header allows the user to select a user for all of the products at once.
- Updated Amount: Shows how much product will be in stock after the inventory is updated.
To save changes, select Update Inventory.
Accessing the Chemical Tracking report
The Chemical Tracking report allows the user to establish the value of the changes made in the inventory. To access the Chemical Tracking report, go to:
Reporting > Inventory > Chemical Tracking Report.

Using the Chemical Tracking report’s Filters
In addition to the filters available in both the Manage Inventory and Distribute Inventory tools, the following filters are available for this report:
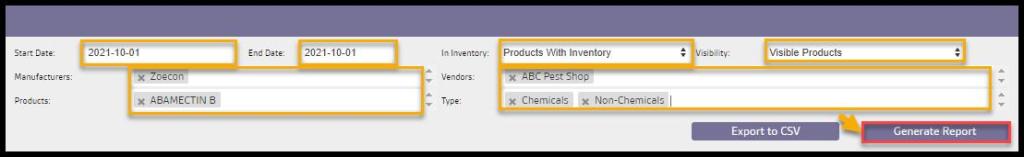
- Start and End Date: Filter the report by inventory changes within a specific date range. The range is limited to 1 year at a time.
- In Inventory: This filter determines which products will be displayed in the report.
- Visibility: This filter is based on a product’s visibility under Admin > Preferences > Products.
- Manufacturers: Restricts the chemicals displayed below to chemicals from selected manufacturers.
- Vendors: When one or more vendors are selected, the amounts displayed in the Increase, Increase Value, Current, and Current Value columns are restricted to added inventory from the selected vendors. Currently this filter only works for added product amounts and no data will be displayed in the Decrease, Decrease Value, Correction, or Correction Value columns.
- Products: Filter by selected products. Only products that are currently set as Visible will be available to choose from. To see hidden products in the report, the user will need to select the “Hidden Products” option from the Visibility filter.
- Type: This filter is based on a product’s type under Admin > Preferences > Products.
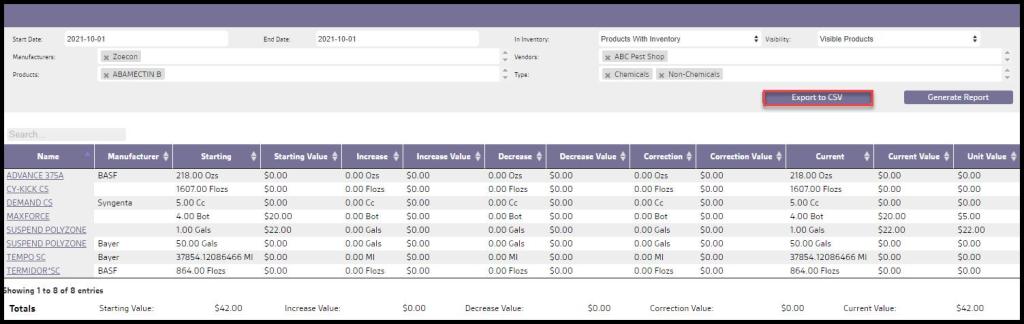
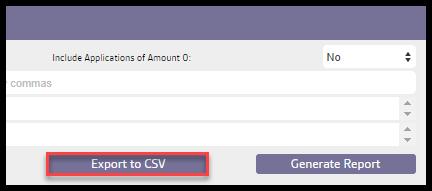
Once the desired filters are selected, select Generate Report. To export the report to Excel, select Export to CSV.
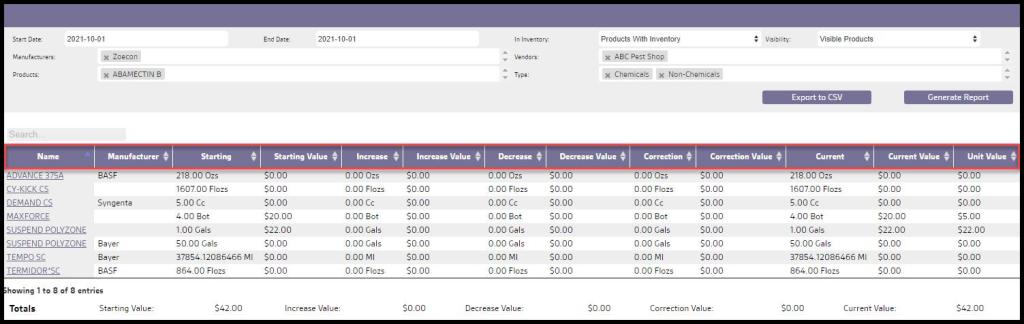
Using the Chemical Tracking report’s Data Columns
The first two columns in the Chemical Tracking report display the name of the product, and the manufacturer. All of the dollar values here are rounded to the nearest cent.
- Starting: The amount of product inventory before the specified start date.
- Starting Value: The value of the starting amount. This is the “Starting” amount multiplied by the “Unit Value”.
- Increase: The amount of increase of product inventory between the specified start and end date. This is the “Increase” amount multiplied by the “Unit Value”.
- Increase Value: The value of the increase amount.
- Decrease: The amount of decrease of product inventory between the specified start and end date.
- Decrease Value: The value of the decrease amount. This is the “Decrease” amount multiplied by the “Unit Value”.
- Correction: The amount of correction of product inventory between the specified start and end date. When the user updates inventory in the Manage Inventory report due to an inventory error, the correction will show here.
- Correction Value: The value of the correction amount. This is the “Correction” amount multiplied by the “Unit Value”.
- Current: The amount of inventory currently in stock.
- Current Value: The value of the current amount. This is the “Current” amount multiplied by the “Unit Value”.
- Unit Value: The value of each unit of inventory. This is not an exact value but a weighted average of the values specified each time inventory is added. The weighted average only takes into account inventory added between the specified start and end date plus the last record of inventory added before the specified Start Date. If the user entered incorrect values in the past, please see the section below on how to remove entries that may be affecting this number.
Seeing more details on a specific product
To see more details on chemical tracking for a specific product, select the product name in the report, and a new window will appear with detailed chemical tracking history for the product.
The user can delete the previous history here in order to fix issues that the user may have had in the past with values that were entered in the Manage Inventory and Distribute Inventory report. Make sure to enter the appropriate date ranges to see all of the history.

Exporting the Chemical Tracking report to Excel
To export the Chemical Tracking report to Excel, select Export to Excel.
Accessing the Inventory Changes Report
The Inventory Changes report allows the user to see a history of changes in product inventory. To access the Inventory Changes report, go to:
Reporting > Inventory > Inventory Changes Report.
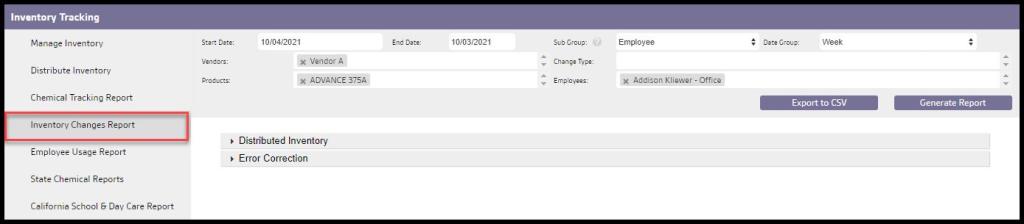
Using the Inventory Changes Report’s Filters
The following filters are available for the Inventory Changes report:
- Start and End Date: Filter the report by inventory changes within a specific date range.
- Sub Group: The user can choose a secondary group for the report. Choose between “None”, “Employee”, or “Vendor”. The employee sub-group will always display returned and distributed inventory. The vendor sub-group will only show new inventory.
- Date Group: Group the report by “Day”, “Week”, or “Month”.
- Vendors: Limit the report to products from specific vendors.
- Change Type: Limit the report by the type of inventory changes. Choose between “New Inventory”, “Returned Inventory”, “Inventory Correction”, “Used Inventory” and “Distributed Inventory”.
- Products: Filter by selected products.
- Employee(s): Limit the report to changes a specific user has made.
Once the desired filters are selected, select Generate Report. To export the report to Excel, select Export to CSV.

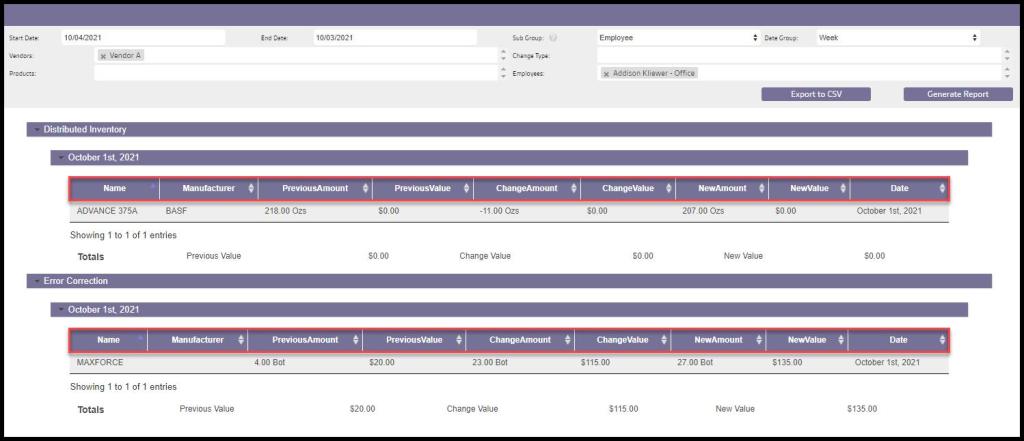
Using the Inventory Changes Report’s Data Columns
The Inventory Changes Report has two sets of data columns, Distributed Inventory, and Error Correction.
Distributed Inventory
- Name: Name of the product.
- Manufacturer: Filter by a specific manufacturer. The list of available manufacturers is generated from what has been used in a product’s details as established in Admin > Preferences > Service Related > Products.
- Previous Amount: The previous amount of the product.
- Previous Value: The previous value of the product.
- Change Amount: The change in the amount of the product.
- Change Value: The change in the value or cost of the product.
- New Amount: The new amount of the product.
- New Value: The new value or cost of the product.
- Date: The date of the distribution.
Error Correction
- Name: Name of the product.
- Manufacturer: Filter by a specific manufacturer. The list of available manufacturers is generated from what has been used in a product’s details as established in Admin > Preferences > Service Related > Products.
- Previous Amount: The previous amount of the product.
- Previous Value: The previous value of the product.
- Change Amount: The change in the amount of the product.
- Change Value: The change in the value or cost of the product.
- New Amount: The new amount of the product.
- New Value: The new value or cost of the product.
- Date: The date of the error correction.
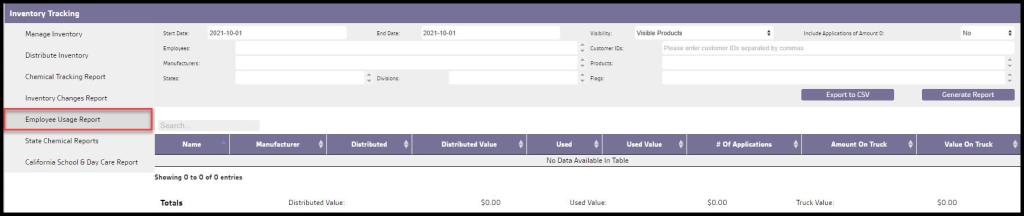
Accessing the Employee Usage Report
The Employee Usage report allows the user to see the amount of product used by each employee and the amount of product used for each appointment. Only completed appointments are considered and only concentrated amounts are reported. The accuracy of this report is dependent upon the accuracy of the amount reported by technicians when completing appointments. To access the Employee Usage report, go to:
Reporting > Inventory > Employee Usage Report
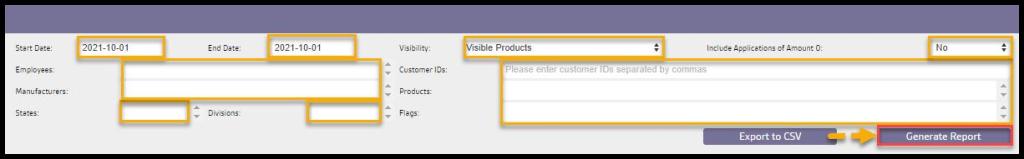
Using the Employee Usage Report’s Filters
This report has similar filters to the Chemical Tracking reports, in addition to:
- Include Applications of Amount 0: Determines if products with no amount entered in are included or excluded.
- Customer ID: Filter by a specific customer the product was used for.
- Manufacturer: Filter by a specific manufacturer. The list of available manufacturers is generated from what has been used in a product’s details as established in Admin > Preferences > Service Related > Products.
- States: Filter by specific state(s).
- Divisions: Filter by specific division(s). Divisions are created and edited in Admin > Preferences > Customer Preferences > Divisions.
- Flags: Filter by specific customer flag(s). Flags are created and edited in Admin > Preferences > Customer Preferences > Generic Flags.
Once the desired filters are selected, select Generate Report. To export the report to Excel, select Export to CSV.
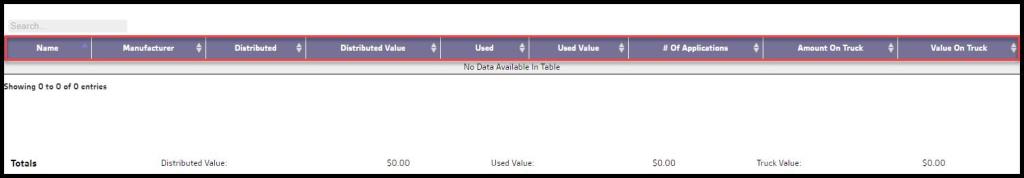
Using the Employee Usage Report’s Data Columns
The first two columns in the Employee Usage report display the name of the product, and the manufacturer.
- Distributed: The amount of product inventory distributed between the specified start and end date.
- Distributed Value: The value of the distributed amount.
- Used: The amount of inventory used on completed appointments between the specified start and end date.
- Used Value: The value of the used amount. This is rounded to the nearest cent.
- # Of Applications: The number of appointments where the product was used between the specified start and end date.
- Amount On Truck: The approximate amount of inventory remaining on technician vehicles. The accuracy of this number is dependent upon the accuracy of the amounts reported by the technicians when completing the appointments and the accuracy by which chemicals are diluted by technicians.
- Value On Truck: The value of the amount of inventory on technician vehicles.
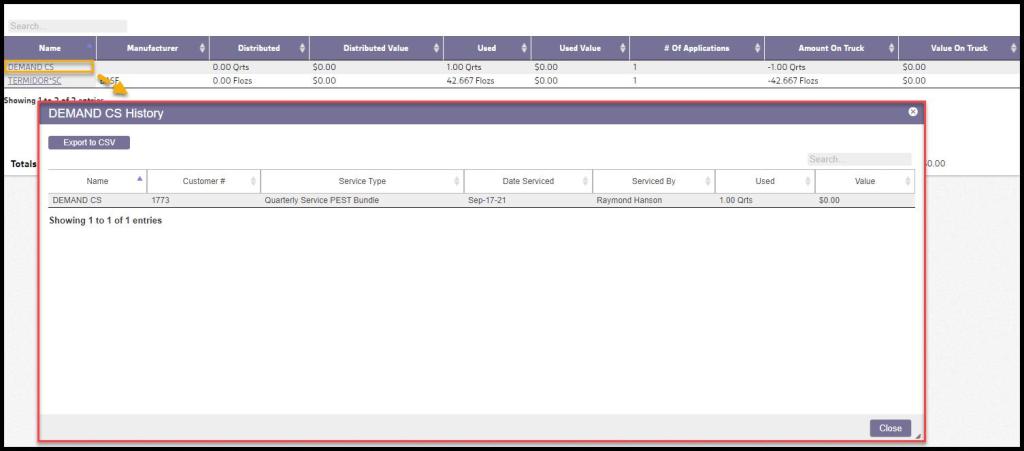
Using the History report in the Employee Usage Report
In the Employee Usage report, the user can click on a product to view a detailed History report.
- Name: Name of the product.
- Customer #: The customer number the product was used for.
- Service Type: The service type the product was used for.
- Date Serviced: The date of the appointment the product was used on.
- Serviced By: The technician that used the product.
- Used: The amount of the product that was used during that appointment.
- Value: The value of the product used. This is rounded to the nearest cent.
Exporting the Employee Usage report to CSV
To export the Employee Usage Report to Excel, select Export to CSV.
Accessing the State Chemical Reports
The State Chemical report allows the user to see the amount of product used in each county that is serviced. This is also a pesticide report some states require the user to provide to them. To access the State Chemical reports, go to:
Reporting > Inventory > State Chemicals Report.
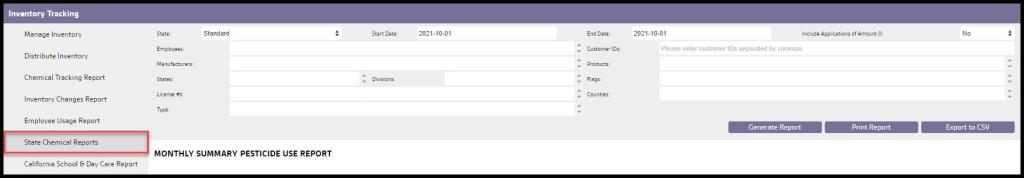
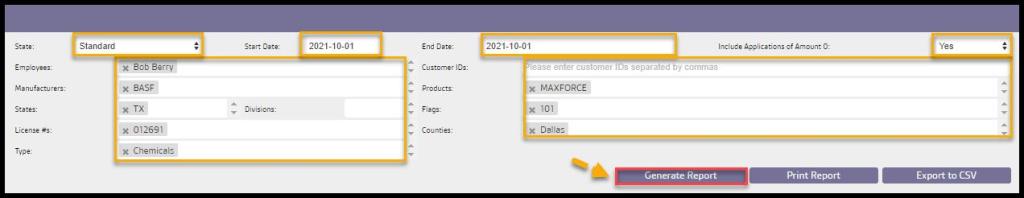
Using the State Chemical Reports’ Filters
The State Chemical report filters unique to this report include:
- State: This filter dictates the report’s format. Supported formats: Standard, California, New York, and Ohio.
- License #’s: Filter by specific license number. The field will pre-populate with license numbers entered into technician’s Employee cards.
Using the New York State Chemical Reports
For New York, there are two factors to consider.
- The Measurement Type: The report only accepts a select number of volume and weight measurement types. If the product is not one of those measurements, then it is omitted from the report.
- Accepted Units of Measurement: Gallons (GL), Quarts (QT), Fluid Ounces (FL), Pounds (LB), Dry Ounces (OZ), Liters (L), Milliliters (ML), Kilograms (KG), Grams (GM), Milligrams (MG)
- Dilution Rate: The Default Dilution rate should be calculated using our Dilution Rate Calculator. Using the Active Dilution of the product from the label will not yield the correct amounts.
Note:
Export to PRL downloads a .txt copy of the report which can be uploaded electronically to the state.
Using the California School & Day Care Report
To use the California School & Day Care Report, please see our guide on the California School & Day Care Report.
