
Intelligent Routing: Visual Grouping
Summary
Visual Grouping is used to assign an area of customers to a Preferred Technician, Day, or Region. Customers are visually grouped by the user using Visual Grouping to prepare them for Intelligent Routing. It is a part of Intelligent Routing, which allows an area of customers to be assigned by a Preferred Technician, Day, or Region, then create pre-built routes that are optimized efficiently.
Accessing Visual Grouping
To access Visual Grouping, go to:
Scheduling > Visual Grouping.

What is Visual Grouping?
The first step in the Intelligent Routing scheduling process is Visual Grouping. With Visual Grouping, the user is not scheduling customers in the software yet – just assigning customers to a preferred technician or region.
The purpose of Visual Grouping is to divide customers into different routing groups, and all customers within each group will always be routed together. Assigning customers to areas with Visual Grouping makes it easier to optimize routes later on with Intelligent Routing.
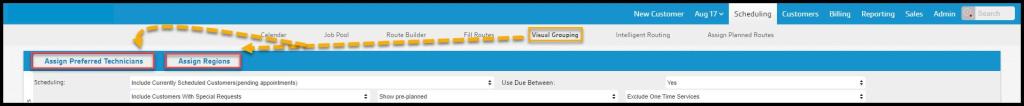
Assign Regions or Assign Preferred Technicians
There are two different methods when grouping with Visual Grouping. You can group customers by the preferred technician or by region.
When choosing to group customers by a preferred technician, the technician will be assigned to each customer within that area. This is great for companies that want to ensure one technician is servicing a customer every time. Only active technician users will be available in Visual Grouping.
Routing by region will allow you to group customers within a general region. You can configure your routing regions by going to Admin > Preferences > Route Regions. Please see the Route Regions guide to learn more about setting up route regions.
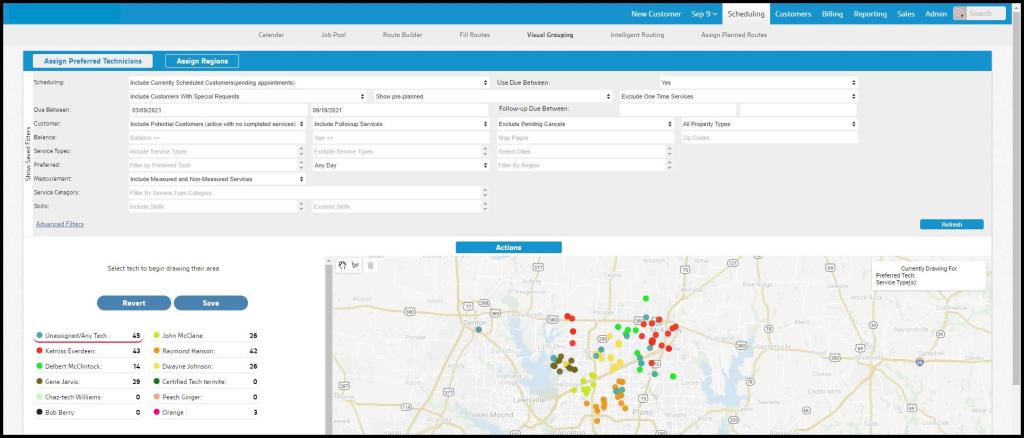
Filtering Visual Grouping
The filters at the top of Visual Grouping are detailed below:
- Scheduling: Include or exclude currently-scheduled Customers.
- Exclude Currently Scheduled Customers
- Include Currently Scheduled Customers (pending appointments)
- Use Due Between: Default = Yes, toggle to No.
- Include Customers with Special Requests: Shows all results regardless of any requests listed on the Special Scheduling field on the Customer Card Info tab.
- ONLY Customers with Special Requests: Shows only those with Special Requests
- Exclude Customers with Special Requests: Filters out all Customers with Special Requests
- Show pre-planned: Default = Include Customers Intelligent Routing has already placed on a pre-planned route but has not yet been scheduled. Toggle to exclude this group. NOTE: If Customers on pre-planned routes are scheduled here, they are removed from those routes.
- Exclude One Time Services: Default = Exclude any non-repeating subscription stops, drop-down options:
- Include One Time Services
- Only One Time Services
- Due Between: These fields allow you to filter by customers that have a service due between a specific date range.
- Customer: Multiple parameters are available to narrow the results based on the information provided on the Info tab in the Customer Cards.
- Map Pages: Limit results to specific Map Pages using Map Page Codes
- Zip Codes: Limit results to specific Zip Codes
- Select Cities: (see below) Limit to Customers in specific cities
- Include/Exclude/ONLY Potential Customers
- Include/Exclude/ONLY Followup Services
- Exclude/Include Pending Cancels
- All/Residential only/Commercial Only Properties
- Balance: The Balance row will consider the balance on the customer’s account. If you do not schedule customers that owe a previous balance, utilize the Balancesection to filter those customers out. You can exclude balances or account ages greater than a desired value.
- Balance is <=: Specify the Account Balance upper limit
- Age is <=: Specify the age of the account balance upper limit in days
- Service Types: Include or exclude a list of specific Service Types in the results
- Preferred: Filter results further by:
- Preferred Tech: Specify those Customers who prefer a particular technician.
- Filter by Region: Limit to the neighborhood, county, etc.
- Customer Flags: Provide any Customer Flags to specifically include or exclude
- Subscription Flags: Provide any Subscription Flags to specifically include or exclude
- Measurement: Use for Dynamically Priced, measurement-based Service Types, allows the inclusion or exclusion of these based on square feet or linear feet measurements.
- Include Measured and Non-Measured Services: Default setting.
- Only Non-Measured Services: Excludes all measurement-based services.
- Only Measured Services: Exclude all non-measurement-based services.
- Only SF Measured Services: Limit to only those measurement-based services in square feet.
- Only LF Measured Services: Limit to only those measurement-based services in linear feet.
- Service Category: Filter results for specific Categories of Service Type, such as Lawn or Pest
- Skills: Filter customers based on the required skills for their services.
Once the filters have been set, select Refresh to update the results.

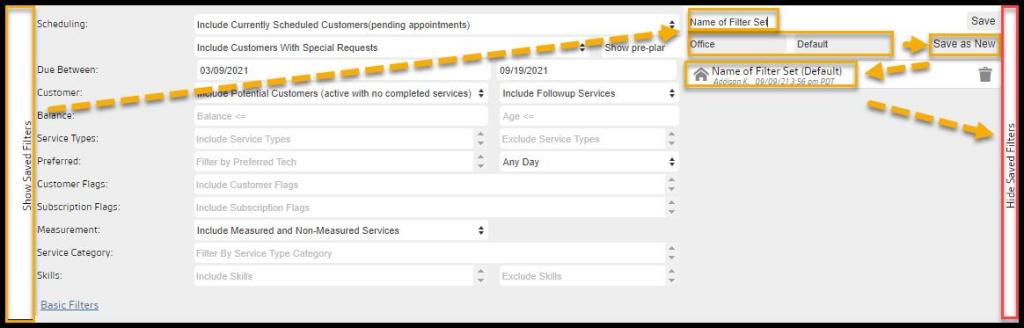
Saving Custom Filters
There are many filters, but saving a custom set of filters is easy. Select Show Saved Filters on the left side of the filters. Insert the name of the filter set, and save it at the user, office, or global level. Determine if it is a default filter, and save the filters for future use.
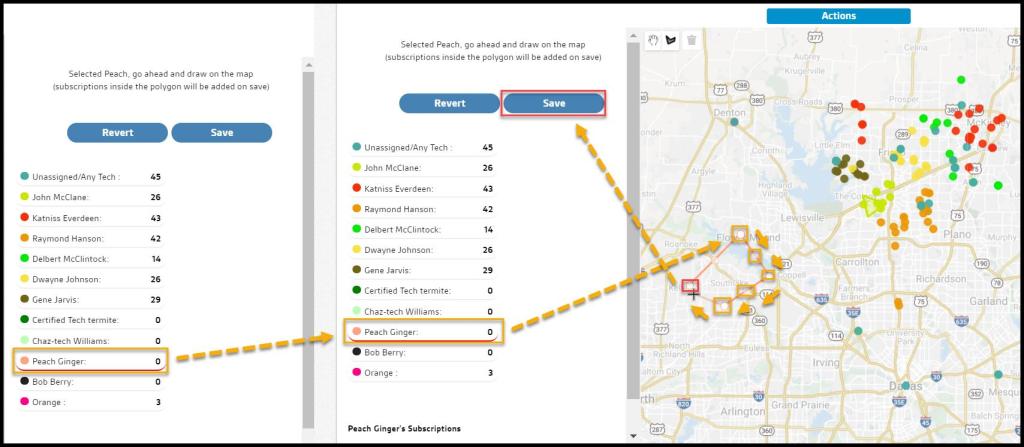
Drawing Borders in Visual Grouping (Assign Preferred Technician)
To draw areas for the technician, select the desired technician from the list to the left and click on the map to apply a starting point for the technician’s area. The area the user draws will be color-coded depending on which technician was chosen.
To edit the area for a technician, select the border on the map and move the different points accordingly. The user can revert any changes by selecting Revert.
To delete an area for a technician, select the border on the map and then select the trash can icon in the top left of the map.
Select Save to save changes.
Once the user has drawn borders over the selected areas, the user can move on to Intelligent Routing.
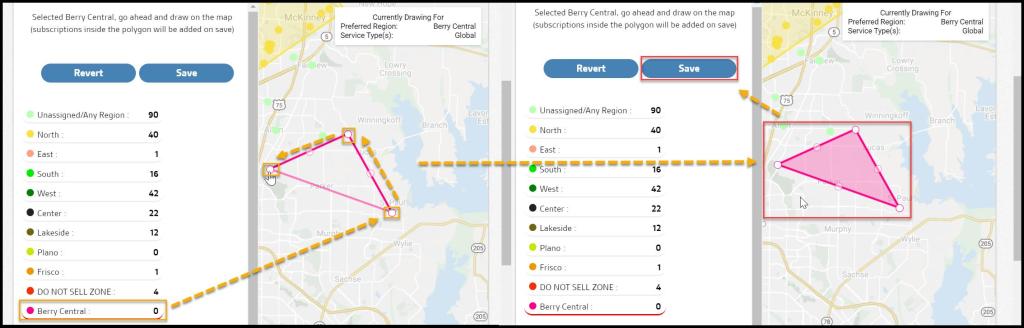
Drawing Borders in Visual Grouping (Assign Regions)
To draw areas for the region, select the desired route region from the list to the left and click on the map to apply a starting point for the region’s area. The area the user draws will be color-coded depending on the chosen region. Route regions can be modified in:
Admin > Preferences > Customer Preferences > Route Regions.
To edit the area for a route region, select the border on the map and move the different points accordingly. The user can revert any changes by selecting Revert.
To delete an area for a region, select the border on the map and then select the trash can icon in the top left of the map.
Select Save to save changes.
Once the user has drawn borders over the selected areas for the route regions, the user can move onto Intelligent Routing.
How does Visual Grouping help the Intelligent Routing process?
Intelligent Routing is the second step in the scheduling process. It’s where customers are optimized on pre-built routes to be scheduled for service. The purpose of Intelligent Routing is to create efficient and optimized routes within each area the user created in Visual Grouping.
